Technique 7.3: Assessing the Creation of Value
Measures for Individuals and Teams
Now that we understand what we are trying to create (content standard) and how we are going to create it (structured workflow), we are ready to develop a measurement model to assess how we are doing. We want to know how we are doing as individuals as well as teams. We have found the approach described in the book The Balanced Scorecard by Norton and Kaplan to be very helpful. It describes a number of important concepts that we have embraced in the KCS Performance Assessment model.
- Link individual goals to departmental and organizational goals to help people see how their performance is related to the bigger picture.
- Look at performance from multiple points of view. The typical scorecard considers the key stakeholders: customers, employees, and the business.
- Distinguish leading indicators (activities) from lagging indicators (outcomes).
In this section, we show examples of how we apply the scorecard methodology to establish and maintain appropriate measures for both individuals and teams:
- Leading indicators (activities) and lagging indicators (outcomes): a very important distinction
- Triangulation—looking at things from at least three perspectives to see who is creating value
- Radar charts—a value footprint: a presentation/visualization technique
- Sample scorecards for knowledge workers and team leaders (managers)
Our first important concept distinguishes between activities and outcomes. If we put goals on activities (leading indicators), we will get what we ask for. Unfortunately, the activity by itself is not an indicator of value nor does it necessarily lead to the outcome we are after. For example, if we set a goal for each knowledge worker to create ten KCS articles per month, we will get ten articles a month. However, we will find that these articles are often created on the last few days of the month and they contain little or no valuable information (things like "fixed customer problem"). They were created to meet the goal, without consideration of the desired outcome. Goals on activities seldom, if ever, generate the desired outcome. In fact, in a knowledge management environment, if we put goals on activities it will corrupt the knowledge base. In the example of a goal on article creation, it's not just that the useless articles are a waste of time - their presence in the knowledge base is actually damaging to the health of the whole KCS system. This is why the distinction between activities and outcomes is so important, and why we say often: do not put goals on activities!
In our example above, the outcome we want is articles that are findable and usable by a target audience. We need to do the "create" activity in the context of the outcome. This reinforces the KCS Principle of Create Value: work tasks, think big picture. The outcome needs to be the focus, not the activity.
Goals placed on activities will corrupt the knowledge base.
Putting goals on activities will:
- Create unwanted results
- Destroy the value of the measure as an indicator of behavior
- Distract people from the real objective
- Relieve people from using judgment
- Make leadership look dull
- Disenfranchise people
A very helpful concept from The Balanced Scorecard distinguishes performance drivers (motivators— covered in the Leadership section) from leading indicators (activities) from lagging indicators (the results or outcomes). While each of these three elements is important, the role each plays in the measurement system is different. Making a distinction between them is crucial.
We need to pay attention to the trends of the activities and their correlation to the outcomes.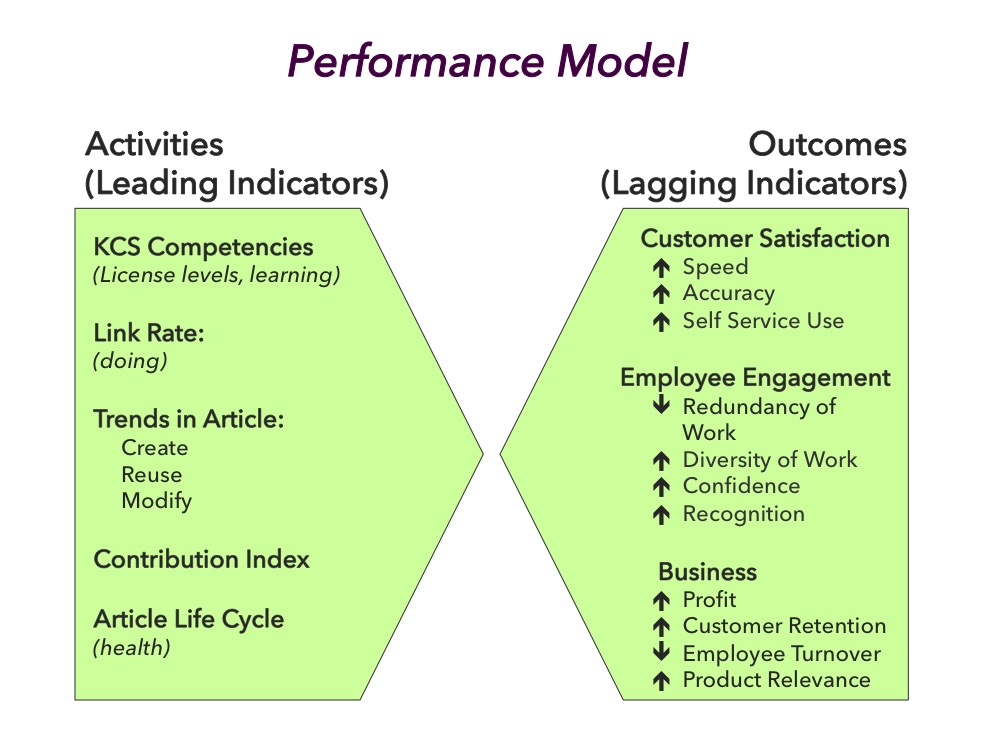
- Are the activity measures heading in the right direction?
- How rapidly are they changing?
- Do knowledge workers have timely visibility to their performance indicators?
While the distinction between activity and outcome measures is critical, we find people struggle with identifying which indicators are activities (leading indicators) and which are outcomes (lagging). Here are some helpful ways to test an indicator:
- Easy to measure and easy to manipulate or game — it is probably an activity (do not put a goal on it)
- Hard to measure and hard to manipulate or game — it is probably an outcome
- Only measurable after the fact (when the event completed)— it is probably an outcome
Whenever we are having a discussion about an indicator or measure, we must be clear as to whether it is an activity or an outcome. See the Metrics Matrix section for examples of activity and outcome metrics.
Triangulation—Who is Creating Value?
The distinction between activities and outcomes is only part of the picture. Effective performance assessment in KCS comes from the integration of multiple perspectives. Because there is no one measure that indicates value creation, we assess it by correlating at least three different perspectives. The basic model includes trends in activities (trend over time), key outcomes (measured against goals), and the KCS Content Standard Checklist (discussed in Content Health). These three perspectives consider measures that are both objective (quantifiable) and subjective (qualitative) to assess value creation by individuals and teams.
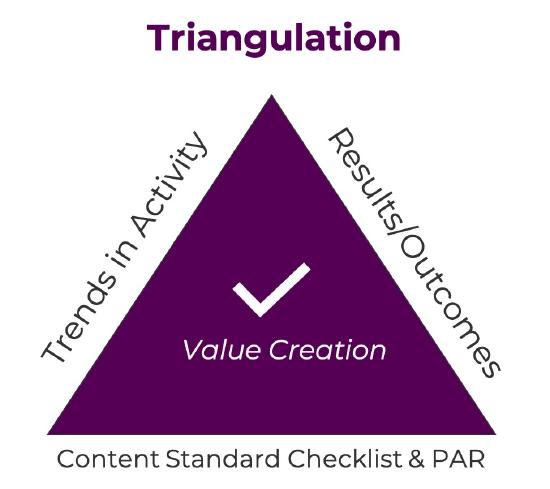 The concept of triangulation reflects the idea that the creation of value cannot be directly measured or counted—value is intangible. We believe the best way to assess the creation of value is through a process of triangulation. As with GPS (global positioning system) devices that calculate our location on the earth based on input from multiple satellites, an effective performance assessment model incorporates multiple views to assess the creation of value.
We offer, as an example, a collection of measures to create an initial assessment model. Every organization must be thoughtful about developing its own set of metrics that align with their organization's goals (documented in the strategic framework).
The choice of measures for KCS must focus on the attributes that create value for the organization. The integration of the following dimensions creates a comprehensive view of performance, which in turn gives us confidence in assessing who is creating value and who might benefit from some help from a Coach.
Aligning to Business Objectives: Balanced Scorecard Example
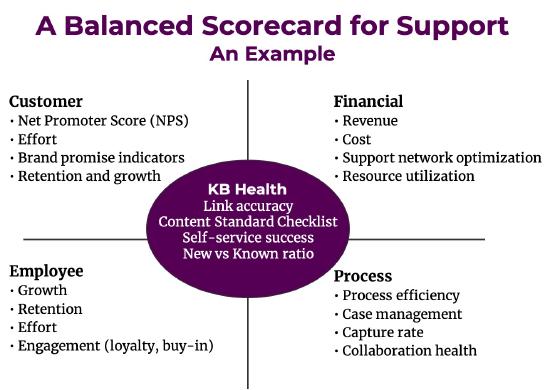 The balanced scorecard format helps ensure that we have encompassed the full range of objectives. We recommend referring to the book for guidance in the process of scorecard creation.
Make Trends Visible to the Knowledge Workers
Consider a driving analogy: we want to go from San Francisco to Yosemite National Park. We could reasonably expect to make the 180-mile drive in three to four hours at an average speed of 55 miles per hour. Our desired outcome is to reach Yosemite in a reasonable period, but we will not know if we have been successful until we arrive. What would we need for the trip? We need a car, a driver's license, and some gas, but a successful trip requires that we also pay attention to many other factors (leading indicators) along the way. Because we would like to average 55 mph, we want to pay attention to how fast we are going. Because we have determined three to four hours is the acceptable period, we want to be aware of the passage of time at different speeds and how much gas we have in order to avoid refueling delays.
The dashboard in the car is very helpful in informing us about the enabling factors for a successful trip. In KCS, the trends in the leading indicators are the dashboard that let the knowledge worker and the organization know the status of the enabling factors. They must be visible to the people who are driving the KCS system: the knowledge workers.
We emphasize this visibility because we have seen multiple organizations implement KCS and not provide the knowledge worker with the feedback they need to adjust their behavior and create optimal outcomes.
Goals for Outcomes, Not Activities!
Because leading indicators are quantifiable activities, they are often easier to measure than outcomes. This creates a seemingly irresistible urge to put goals on the activities that are required for the outcome. As we have mentioned a few times, this is... counterproductive.
Consider the trip to Yosemite. If the stated goal were solely maintaining an average of 55 mph, it could be done. But in the absence of understanding the objective (Yosemite) the driver will choose roads that allow him to maintain the average speed regardless of destination. We might end up in Chico! Not that Chico is a bad place; it just is not where we wanted to go.
During the KCS adoption process, we have seen organizations put goals on KCS article creation (everyone should create five KCS articles a week) or KCS article reuse (knowledge workers will be measured on how often they link KCS articles). The goals for these leading indicators may have been met, but the quality of the knowledge base has been seriously compromised. Invalid and duplicate KCS articles are created, because the focus is on the activity, not the outcome. Worse, emphasis can shift to gaming the system rather than generating real value. Inevitably, quality and morale suffer, management looks less competent, and the value of the knowledge is diminished.
However, the trends in the activities (link, modify, create) give us valuable insights about knowledge worker behavior, so long as (we will say it again) there are not goals on the activities. If we put goals on these activities, the trends become meaningless as indicators of behavior and we will have lost valuable insights. The activities are also an early indicator of how effective the organization's leadership has been in describing the purpose and benefits of KCS and inspiring knowledge workers to embrace the Solve Loop practices. If people understand why they are doing it and what is in it for them (WIIFM), the likelihood that they will contribute appropriately is greatly increased. If the knowledge workers know we are trying to get to Yosemite, they will make good judgments about the activities it will take to achieve that outcome. If they don't know where we want to go, they may meet all the activity goals but who knows where we will end up. Refer to the Leadership and Communication practice for more details on communication and motivation.
Knowledge Worker Visibility to Measures
Knowledge worker visibility to measures is a delicate thing. We have conditioned them to expect goals on measures. In some cases if leadership does not put a goal on the activities, the knowledge worker will self impose one - which is as dysfunctional as leadership putting goals on activities. It is critical that knowledge workers get feedback on how they are doing and coaching on how they could improve. The conversation with both coaches and leaders needs to be focused on behaviors and outcomes. While the activity trends and a comparison of activities to peers doing similar work can provide helpful insight to the knowledge worker behavior, the conversation needs to be about their understanding of the Solve Loop and the content standard - not about the numbers.
On the other hand, numbers can have a positive impact when talking about outcomes. A key responsibility of leadership is providing knowledge workers with visibility to the impact their contribution to the knowledge base is having on the outcomes. Quantifying these benefits, using numbers and percent improvement on outcomes or progress toward a goal is very beneficial. If the knowledge workers can not see the impact of their contribution, they will stop contributing.
A Scenario—Examples of KCS Reports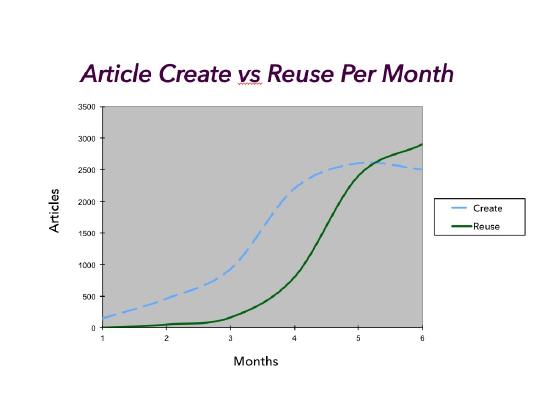
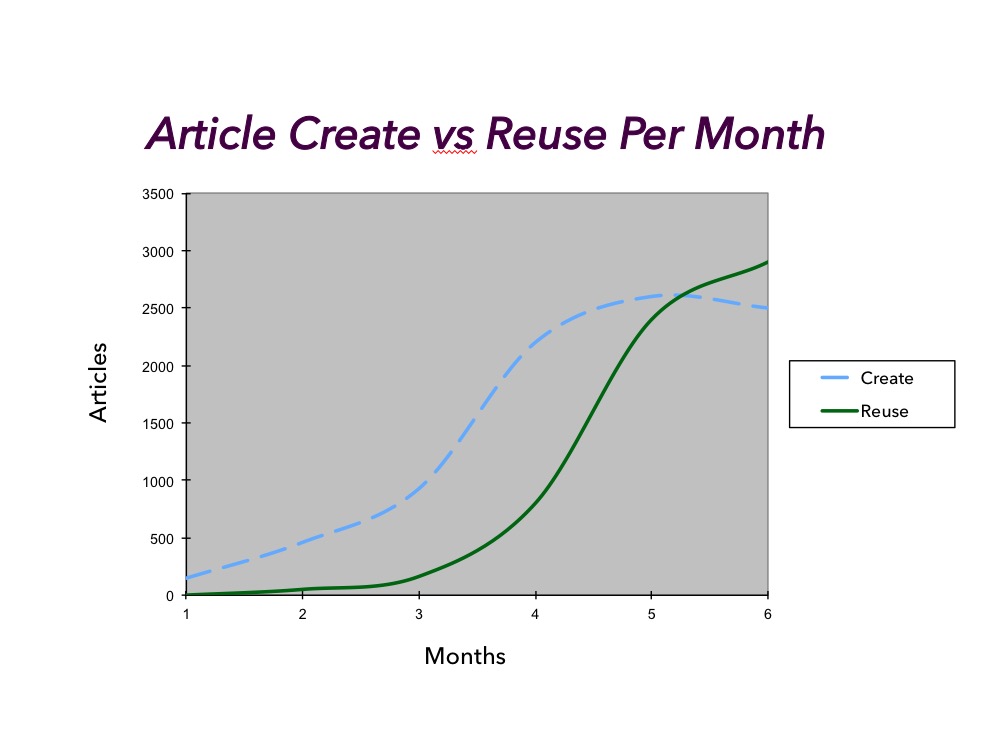
The example to the right is for the first six months of an organization's adoption of KCS.
KCS Article Creation and Reuse
KCS article creation will naturally lead KCS article reuse. As an organization approaches maturity, they will have already captured a high percentage of the known KCS articles, so the creation rate should drop off, and the reuse rate will continue to climb. Because of its link to product life cycles, this pattern will repeat itself with each new product or application introduced.
KCS Article Life Cycle Trend
The KCS article life cycle gives us a sense for the speed with which articles are moving from a Not Validated state to a Validated state and/or External state. Because the value of the knowledge increases as the visibility of the article increases, we want to make sure that there is no bottleneck in the system. Articles in the Validated state are generally visible to a much larger audience than Not Validated articles, while External articles are generally available to people outside the organization.
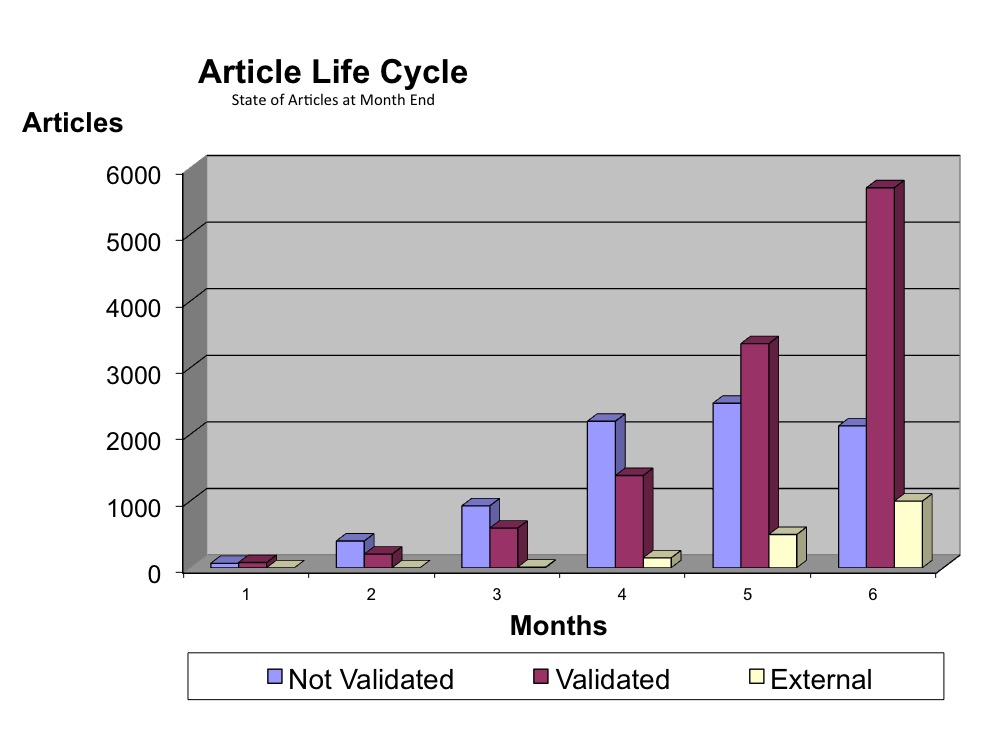 In the chart on the left, we see good movement of KCS articles from Not Validated to Validated. Of the 9000 KCS articles that have been created in the knowledge base, about 7800 of them are Validated or External. There does seem to be some kind of hold-up in getting KCS articles published.
Link Rate as an Indicator
The link rate is powerful leading or early indicator of knowledge worker behavior. Link rate is defined as the percentage of events or incidents handled that have an article linked. We divide the number of incidents that have an article linked by the total number of applicable incidents closed. We should note that every organization has some events or incidents where linking does not make sense: it adds no value. Stated another way, link rate measures the percentage of times we link when linking is appropriate.
Link rate is an important trend to watch as the organization adopts KCS. In general, a healthy link rate for an organization is in the range of 60-80%, although specific numbers vary based on which incidents are included into this calculation. Link rate is an indicator of how often the knowledge base is being used as part of the knowledge worker's process. The link rate reflects reuse of known or existing articles as well as articles created because one didn't exist. For example, if we closed ten incidents this week, and we reused six KCS articles and created two new KCS articles, our link rate would be 80%.
In some organizations, there isn't an "incident" per se, so there is no ratio of knowledge use to incidents, and thus no link rate. Even without the rate, calculating an article utilization rate as the total number of articles used divided by volume of events provides insight into the organization's engagement with Solve Loop practices.
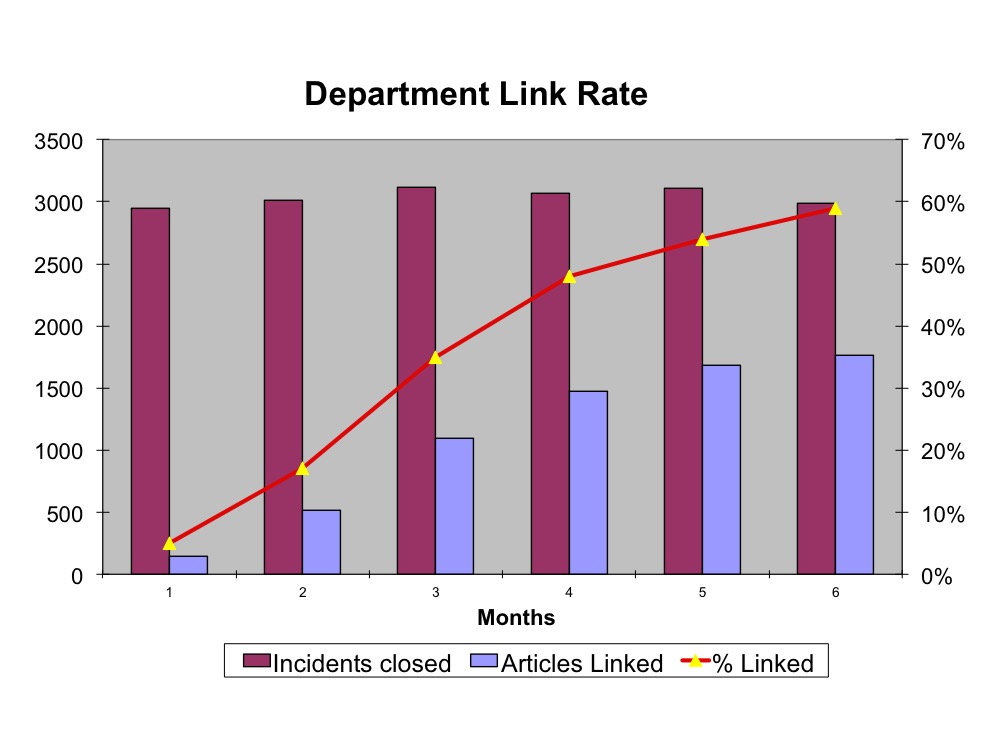
This organization appears to be doing fairly well. We certainly like the trend in the department link rate.
We must look at participation for the group as well as for the individual. As mentioned, link rate can be a good, early indicator of knowledge workers embracing the Solve Loop.... so long as there is not a goal placed on link rate. 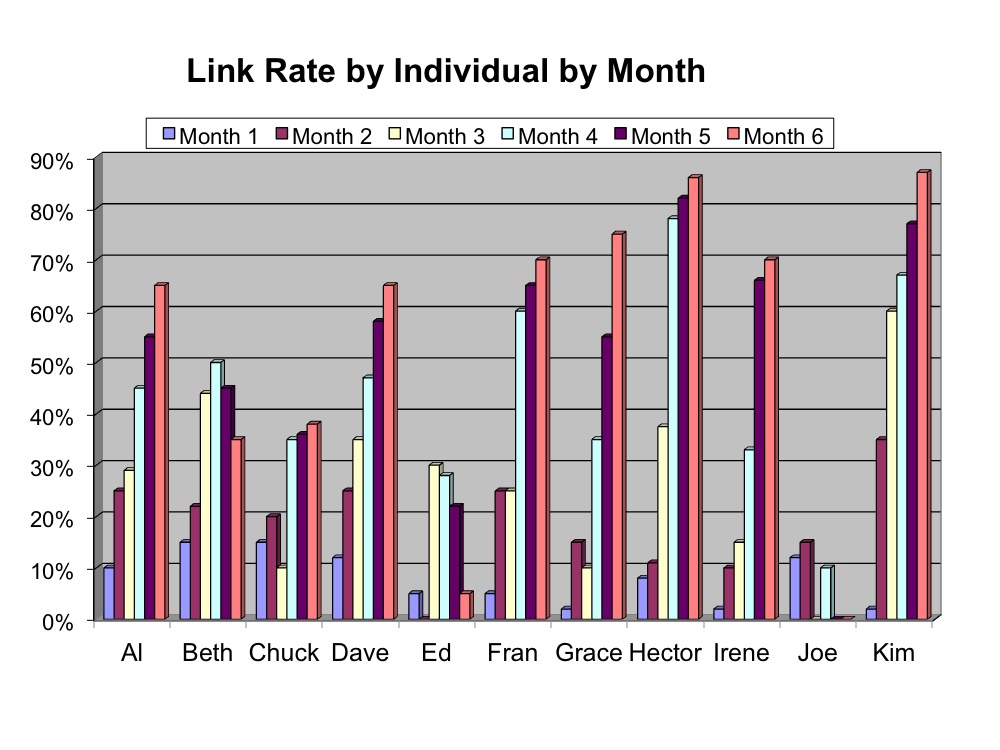
Here we can see there is a wide range of link rates across the group. A conversation with Ed and Joe about their workflow and how they are using the knowledge base might be a good idea. Because link rate is the ratio of incidents closed to articles linked, it makes it hard to come up with a scenario for Joe or Ed that says they are "doing well." Link rate is a powerful indicator of anyone who is not playing. Again, we raise the caution that the conversation with the knowledge worker needs to be about their understanding of KCS, the Solve Loop, and their use of the knowledge base, not about their link rate "score."
Let us consider Kim and Hector —are they the new heroes of the organization? They seem to be doing really well. But, we don't know enough about Kim and Hector to know if they are creating value in the knowledge base or are just busy creating KCS articles that might be duplicates or incomplete. We need more information.
Profiles of the Players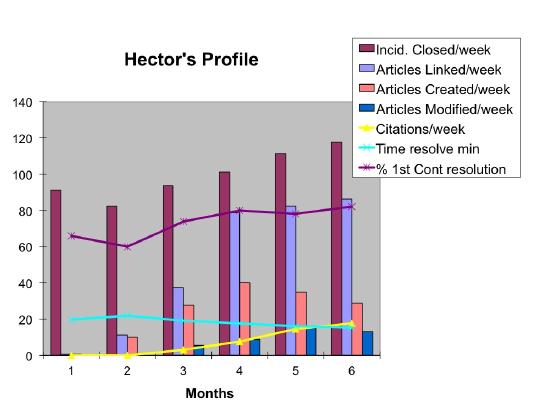
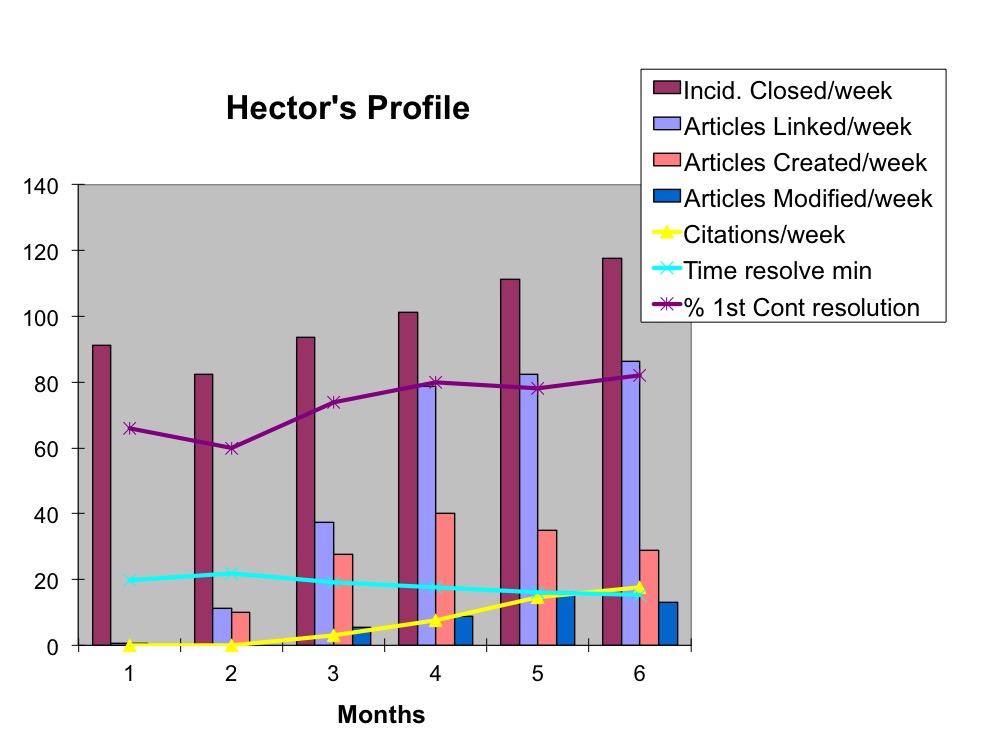
It is interesting to look at a KCS indicators profile by individual. Here's an example of Hector's profile. While it contains a lot of data, the combination of factors gives us a better sense of Hector's contribution. We have averaged many of the factors over a week's time. Incidents closed, KCS articles linked, KCS articles created, KCS articles modified (improved), and citations (others use of KCS articles Hector has created) are all represented on a per week basis. Time to resolve and first contact resolution are the monthly averages.
On the link rate chart above, Hector and Kim both appear to be star performers. With the profile view, we see something different.
Kim, on the other hand...
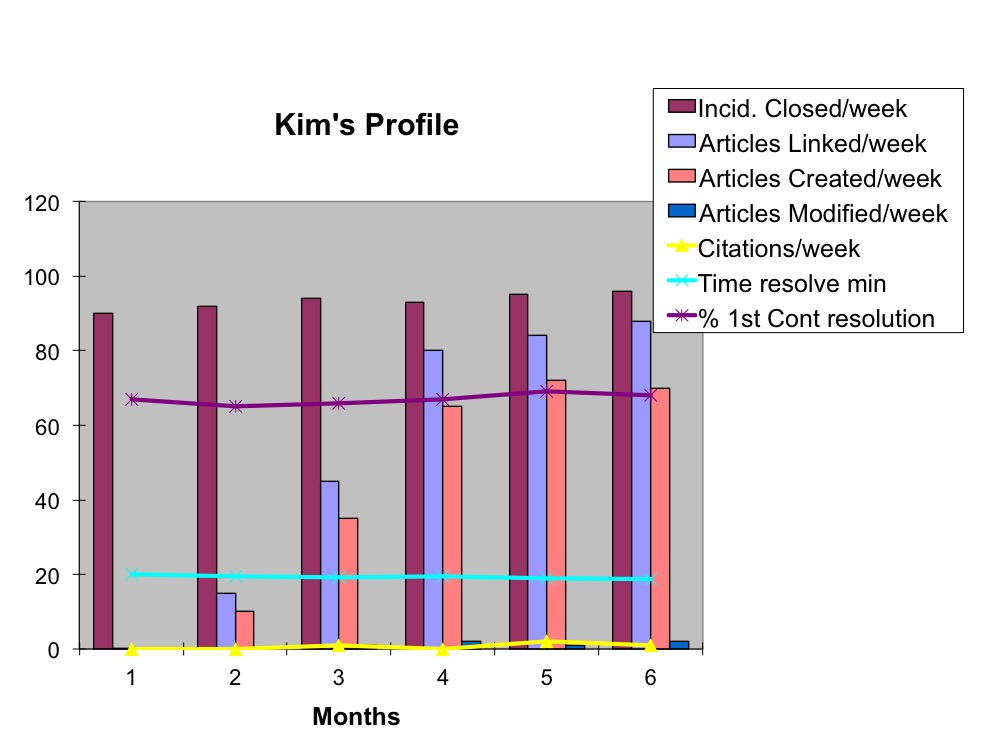
Here is a great example of why a profile with multiple indicators is preferable over one with only a single measure. There is no single measure for value creation. If we looked only at link rate, then both Kim and Hector would appear to be doing very well. However, upon reviewing Kim's profile, we see that the article created rate represents most of her activity. She does not often modify others' articles and, in fact, does not reuse others' articles very often. The difference between KCS articles linked (used) and the articles created represents article reuse.
In Kim's case, we see KCS article creation makes up most of the KCS articles linked, which indicates relatively low reuse. Based on her citations levels, we can also see that others are not using the KCS articles that Kim creates. We might infer from all this that Kim is not searching the knowledge base before creating new articles, and that the KCS articles she creates are not very useful to others. A conversation with Kim is definitely in order. It may be that she does not understand the KCS processes. However, Kim may also be working on a new release or supporting a beta product, in which case her profile might represent a very good contribution.
Even with all this data, we still do not have enough information to determine who is creating value. We are missing a qualitative view (indicators of quality) to balance the quantitative view (activity).
If we refer back to the Content Standard Checklist we discussed earlier, we can get an additional perspective on Hector and Kim's behaviors and contribution.
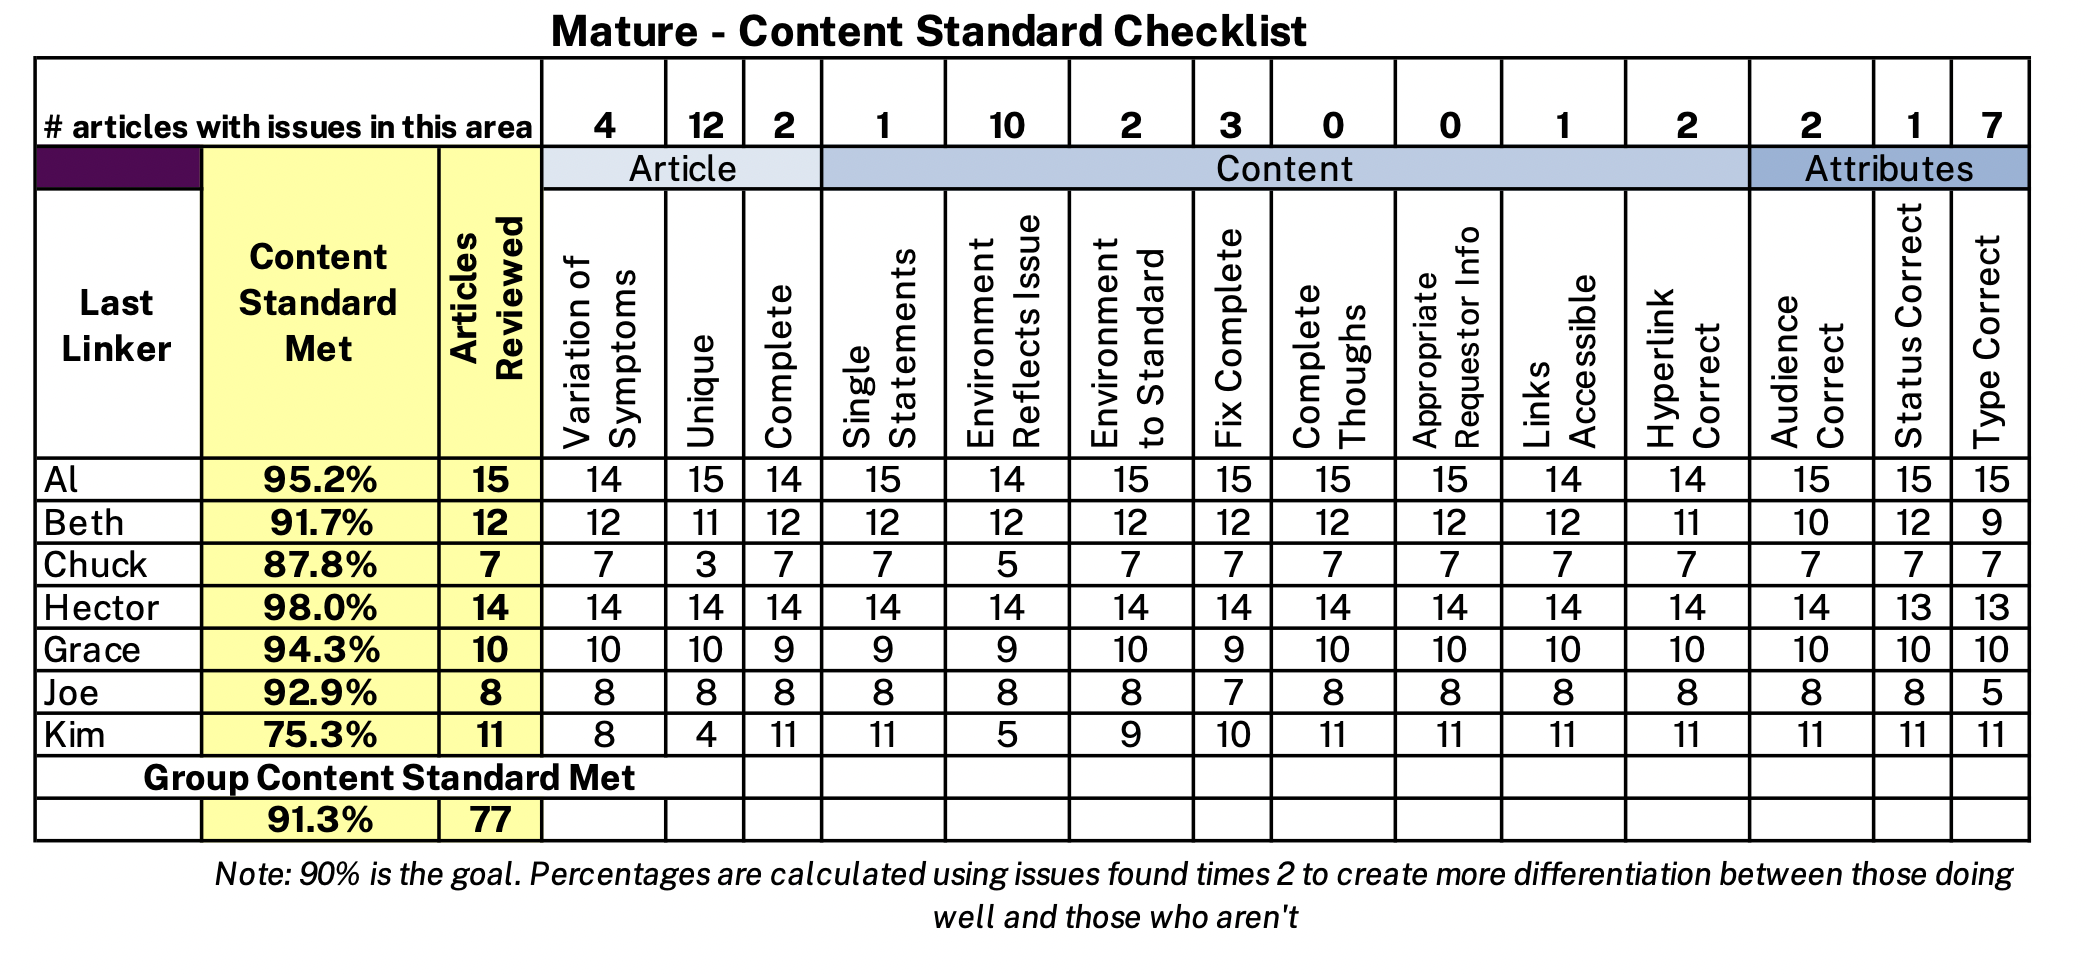
Hector's Content Standard Checklist percentage is 98%; he consistently creates articles that adhere to the content standard. In contrast, Kim's percentage is 75.3%, which is below the goal (the Content Standard Checklist percentage is an outcome and should have a goal), and the frequency of duplicates is very high. This high duplicate rate reinforces the idea that Kim is not searching before resolving and creating. While her activity level is excellent, that activity is corrupting the knowledge base because of the level of duplicate KCS articles introduced.
There is one more perspective that can further increase our confidence in who is creating value and who might need some help from a coach. The Content Standard Checklist tells us who understands and adheres to the content standard. The last piece of the puzzle is provided by the PAR (Process Adherence Review - formerly Process Integration Indicators) which helps us understand who is doing the Solve Loop: who has really integrated use of the knowledge base into their workflow.
 Here is an example of the spreadsheet used to collect the data and calculate the Process Adherence Review (PAR). The key things we want to look at here are the Link Rate, Link Accuracy and the Contribution Index (see Contribution Index section in Technique 6.5: Process Adherence Review for details on this).
Looking at the contribution rate and the link accuracy, we see more evidence that Hector is creating value and Kim needs some help. Hector's link rate, link accuracy, and contribution index are all very good. Looking at Kim we see her link rate is good, but her link accuracy is well below the required 90% and her link contribution index is very poor compared to her peers.
Looking at knowledge worker value creation requires that we use a comprehensive set of measures. By looking at a combination of Content Standard Checklist and PAR we get an accurate view of who is creating value and who needs some attention from a coach.
Radar Charts - Creating a Value Footprint
The scenario with Hector and Kim requires a great deal of data and analysis with multiple charts for multiple people. A leader with a team of fifteen knowledge workers is not likely to have the time to routinely do that level of analysis. Can we make it easier to quickly identify who is creating value and who needs help? For rapid assessment, we use a tool called the Radar Chart.
Creating a Radar Chart requires some thought. First, we want to be sure we get a balanced view. Our key metrics should reflect a balance of:
- Leading and lagging indicators (activities and outcomes)
- Quantity and quality
The leading indicators (activities) are compared to the team average (not a goal) and lagging indicators (outcomes) are compared to the goal.
Secondly, we have to normalize the values to a common scale—for this example we will normalize to 1, so anything less than 1 is not meeting the team average or the goal, and anything greater than 1 is better than the team average or exceeds the goal. In the case of the leading indicators (activities), we will normalize it to the team average (do not put goals on activities). For the lagging indicators (outcomes), we will normalize the goal to 1.
We have to decide what measures to use in the radar chart. Organizations that use radar charts each have their own set of measures, usually defined by the KCS Council team.
For our example we will use Hector and Kim's data from the scenario and we will use the following measures:
- Customer satisfaction index (assuming this is captured at the individual level)
- Based on post incident closure surveys, the goal is normalized to 1
- Knowledge contribution
- Content Standard Checklist; based on sampling of articles, the goal is normalized to 1
- Citations, (peer's use of articles, # per month, 1 = team avg.)
- Process and Operations
- Incidents handled; the number of incidents handled/month, the team average is normalized to 1
- Avg TTR: Average time to relief (average minutes to provide relief/answer), the team average is normalized to 1 (note that the individual values for Avg TTR have to be inverted; a shorter TTR than the team average has to have a value greater than 1 and longer is less than 1)
- Link rate; the % of cases closed with a resolution linked, the team average is normalized to 1
Once we have decided on the measures we want to include in the radar chart and the calculations for normalizing them to 1 we can plot the chart. Following are Hector and Kim's value footprint. We can see that these charts are much easier to read than the array of graphs we used in the scenario.
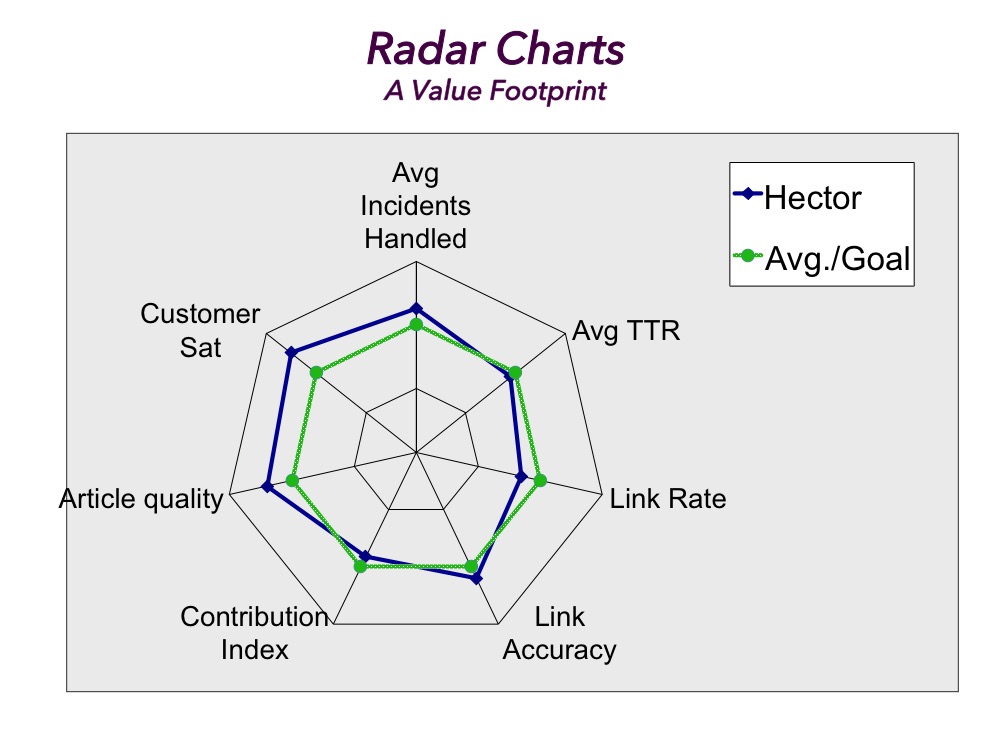

By comparing an individual's performance to the team averages for leading indicators and the goals for the lagging indicators, we can quickly see that Hector is creating value, and Kim needs some help. This is a helpful way to view measures so long as we have a balanced view of leading and lagging indicators as well as qualitative and quantitative measures. However, no measure or collection of measures can be meaningful without an understanding of the context in which the individual works and the role of the individual. Assessing the data in the context of the environment is a key responsibility of the team manager. We find that the assessment of value creation in a KCS environment is so different from the transaction and activity based measures we have conditioned first and second line managers to use that the managers need training on how to interpret and use value based measures.
Is What We Talk About Important?
Note that the eventual conversation with Kim should be about the behaviors and her process for problem solving, not about her participation numbers or the Content Standard Checklist percentage. The numbers are the indicators. If the conversation is about the numbers, then the numbers become the focus. We want Kim to adjust her behavior; her problem-solving process might not align with the KCS practices. If we coach her on the structured problem solving process and the Solve Loop practices, the indicator should reflect the change. However, if we talk with Kim about "fixing her numbers," she can do that, but now the indicator becomes useless.
The moral of the story here is three-fold.
- We cannot depend on one measure or indicator to determine the health of the KCS system or the contribution of the players.
- The indicators must be used along with an understanding of the nature of the environment. Assessing the creation of value requires that we have a holistic view of performance.
- Trends in activities (leading indicators) can be very valuable, especially link rates. But the value of the indicator will be lost if we put a goal on the activity or we focus on the number during conversations with the employees.
The conversation about performance improvement is about behavior, process, and understanding - not about the numbers.
Team Performance - Management Effectiveness
We can use radar charts for the team performance and as a way to assess the effectiveness of the leadership in creating an environment for KCS success. For the team radar chart, the same rules for balance apply but the measures we use would be different. The measures for a team will depend on the size of the team and the size of the organization. We offer the following as an example where the team is the support organization and can influence the measures listed.
For the team's radar chart we might use the following measures: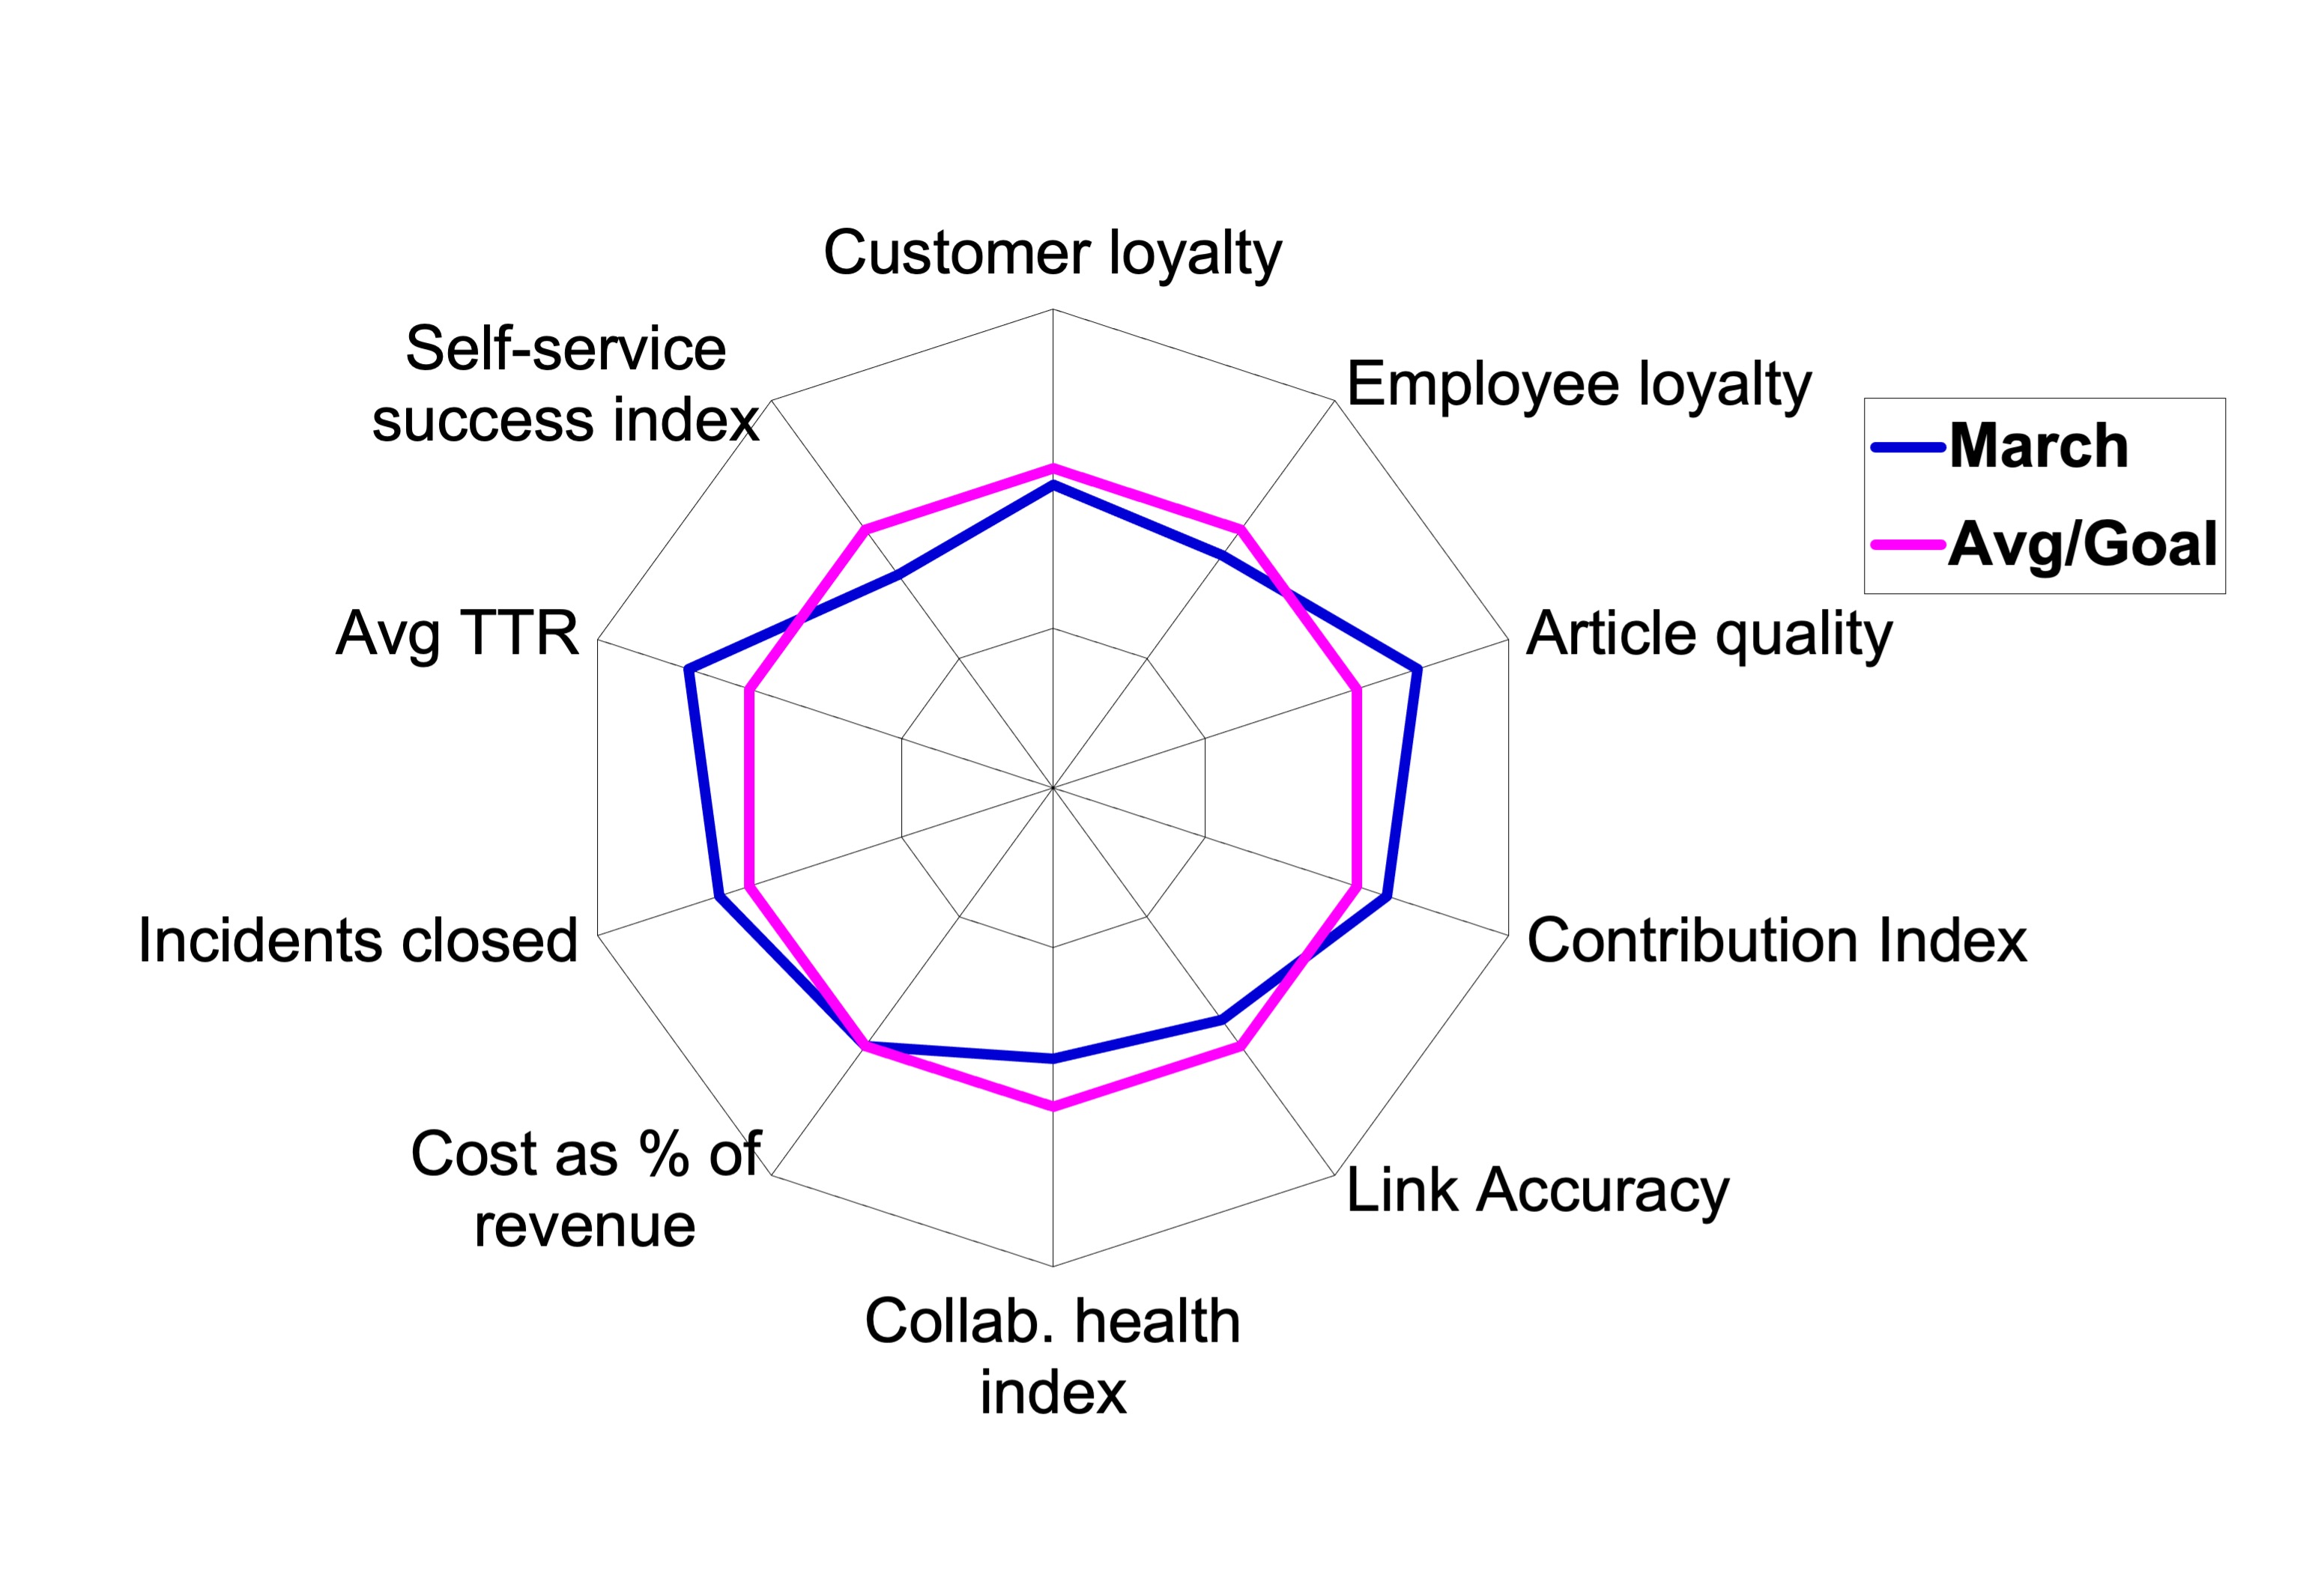
- Customer loyalty - unlike customer satisfaction, which typically measures the transaction, loyalty measures the customer experience over time and their emotional connection to the company (1 = the loyalty goal)
- Employee loyalty - loyal employees are a prerequisite to loyal customers (1 = the employee loyalty goal)
- Collaboration health index - the teams ability and willingness to collaborate; key indicators are trust and a sense of connectedness to the team
- Support cost as a percent of revenue
- Incidents closed
- Avg TTR - Average time to relief for the team
- Customer success on the web, (index = of % customers using web 1st x % success)
It is important to reiterate that numbers never tell the whole story. As with many things in the KCS methodology, judgment is required. This is true for the knowledge workers as well as managers.
While radar charts are good at showing a collection of data or measures at a point in time, they are not great at showing trends. Trends are especially important for the leading indicators (activities) like article creation and linking rates.
An organization can have the best measurement system in the world, but it is only effective if the managers know how to interpret the measures and how to have effective conversations with employees that influence behavior. Performance assessment and the creation of value is fundamentally about behavior and decision making, not about the numbers.
Focus Shift Through Phases of Adoption
During the KCS Adoption, we want to focus on indicators for individual development, adoption of the Solve Loop practices, and adherence to the content standard:
- Learning
- KCS competency levels across the organization (% of the organization in each of the levels: KCS Candidate, KCS Contributor, KCS Publisher)
- Time to KCS proficiency (number of days to reach each competency level)
- Knowledge contribution
- KCS article creation rate (people are creating KCS articles as they solve problems)
- KCS article modify rate (people are improving KCS articles as they use them)
- KCS article reuse rate (people are using KCS articles they find in the knowledge base to solve problems)
- Knowledge base participation (% of incidents handled using the knowledge base)
- KCS article rework rate (KCS article flagged as needing attention because it could not be understood or fixed by the person who found it)
- KCS article cycle time (rate at which KCS articles move through their life cycle)
- KCS Content Standard Checklist (random sampling of articles)
-
Process and Operations
- Incidents handled, individual (# of incidents handled/month, 1= team average)
- Average time to relief, individual (average minutes to provide relief/answer, 1 = team average)
As the organization matures and KCS becomes second nature for knowledge workers, we shift our focus from individual measures to a balance of individual and team or collaboration measures:
- Collaboration and teamwork
- Reputation and peer feedback
- Invitation rate (number of times invited to collaborate)
- Opt-in rate (number of times the invitation is accepted)
- Knowledge contribution—reuse by others (citations)
- KCS Content Standard Checklist for the team
- Citations or feedback from customers
- Customer success on the web (index = of % customers using web first x % success)
Sample KCS lagging indicators:
- Loyalty/satisfaction index (team)
- Based on surveys, team (post incident and periodic)
- Retention rate/renewal rate
For a complete list of all the KCS measures the Consortium has considered please see the Appendix - Metrics Matrix
Summary: Performance Assessment
Performance Assessment for KCS represents a departure from traditional management practices. It focuses on collaboration, not competition, and assesses the creation of value, not activity. Job descriptions and expectations must shift to include the capture and maintenance of knowledge in the workflow (the Solve Loop). The measures must reflect the concept of collective ownership of the knowledge base.
Here are the key points to remember:
- Use a license model (KCS Candidate, KCS Contributor, KCS Publisher) to manage and encourage proficiency
- Align individual and department goals to the higher level company goals (strategic framework)
- Distinguish activities from measures
- Look at trends and performance against team averages for the activities and create goals for the outcomes
- Use both the Content Standard Checklist and PAR to create a comprehensive view
- Be thoughtful about what measures you focus on and create a balanced view
- Objective and subjective measures
- Individual and team measures
- Trends in activities and attainment of goals for outcomes
- Enable timely feedback to the people doing the work
- Conversations with knowledge workers must focus on behavior, process, and understanding, not on the numbers
- Plan to evolve the measures as the organization matures