_(1).svg?revision=1)
KDA Measures
KDA Program Impact
The Knowledge Domain Analysis program impact is measured in three key areas:
Responder process improvements
- Improve average time to relief (time to resolution offered)
- Increase consistency and effectiveness of the approach to generic symptoms
- Use of hub articles and resolution paths by the knowledge workers
- Increase in findability: improve the time to recognize and resolve known issues
- Improvements in the workflow and content standard
- Improvements in link accuracy and link rates
Requestor use of and success with self-service
- Increase requestor use of self-service
- Increase in self-service success rate
- Shift in the new vs known ratio to a higher percentage of new and lower percent of known for agent-assisted issues
Organizational improvements in products, services, processes, and/or policies
- Time to identify trends
- Time to cure (remove the cause of the issue from the environment). This is a cross-functional measure as support is often dependent on other organizations to implement changes
Ultimately, KDA measures are indicators that show what we are learning about the domain from requestor activity in the knowledge base, self-service, communities, and social networks.
Many of these indicators take time to see improvement. For some of the indicators, it can be hard to determine an absolute cause and effect. There are numerous variables that influence these indicators, and success often requires cross-organizational cooperation.
In order to track our progress, we need to set some baselines for these indicators early in the KCS journey. The following are some suggested baseline measures for the new measures associated with the KDA program. For the sake of illustration, we have included examples of charts with the expected trends that would show progress.
Linking Ratios
As we have and will continue to mention, the behavior of the knowledge workers in handling requests (the Solve Loop activities) creates the data that enables many of the analysis activities of the KDEs. The frequency and accuracy of linking knowledge articles to requests is critical. While the coaches have significant influence over this, the KDEs have opportunities to provide feedback and suggestions that influence the Solve Loop behaviors.
Setting a baseline for linking rate and linking accuracy should be the result of the initial Process Adherence Reviews (PAR). These indicators are validated through the New vs Known analysis as well.
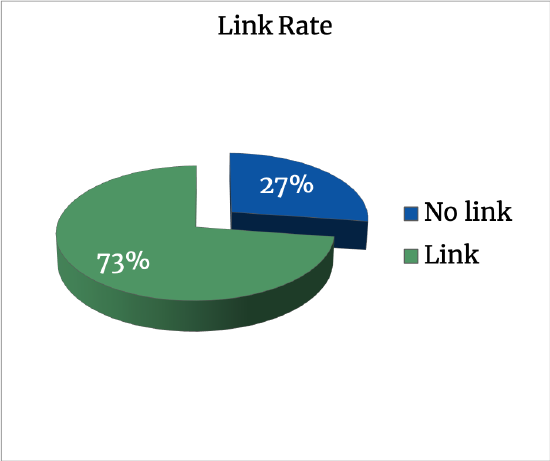
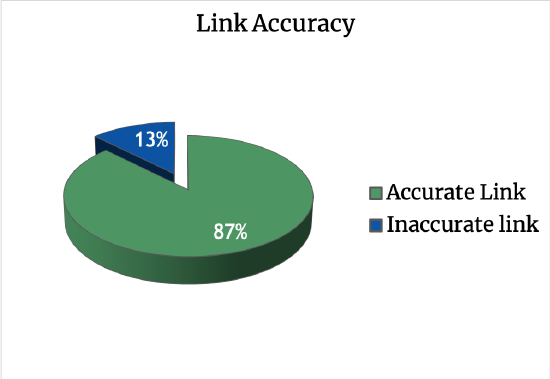
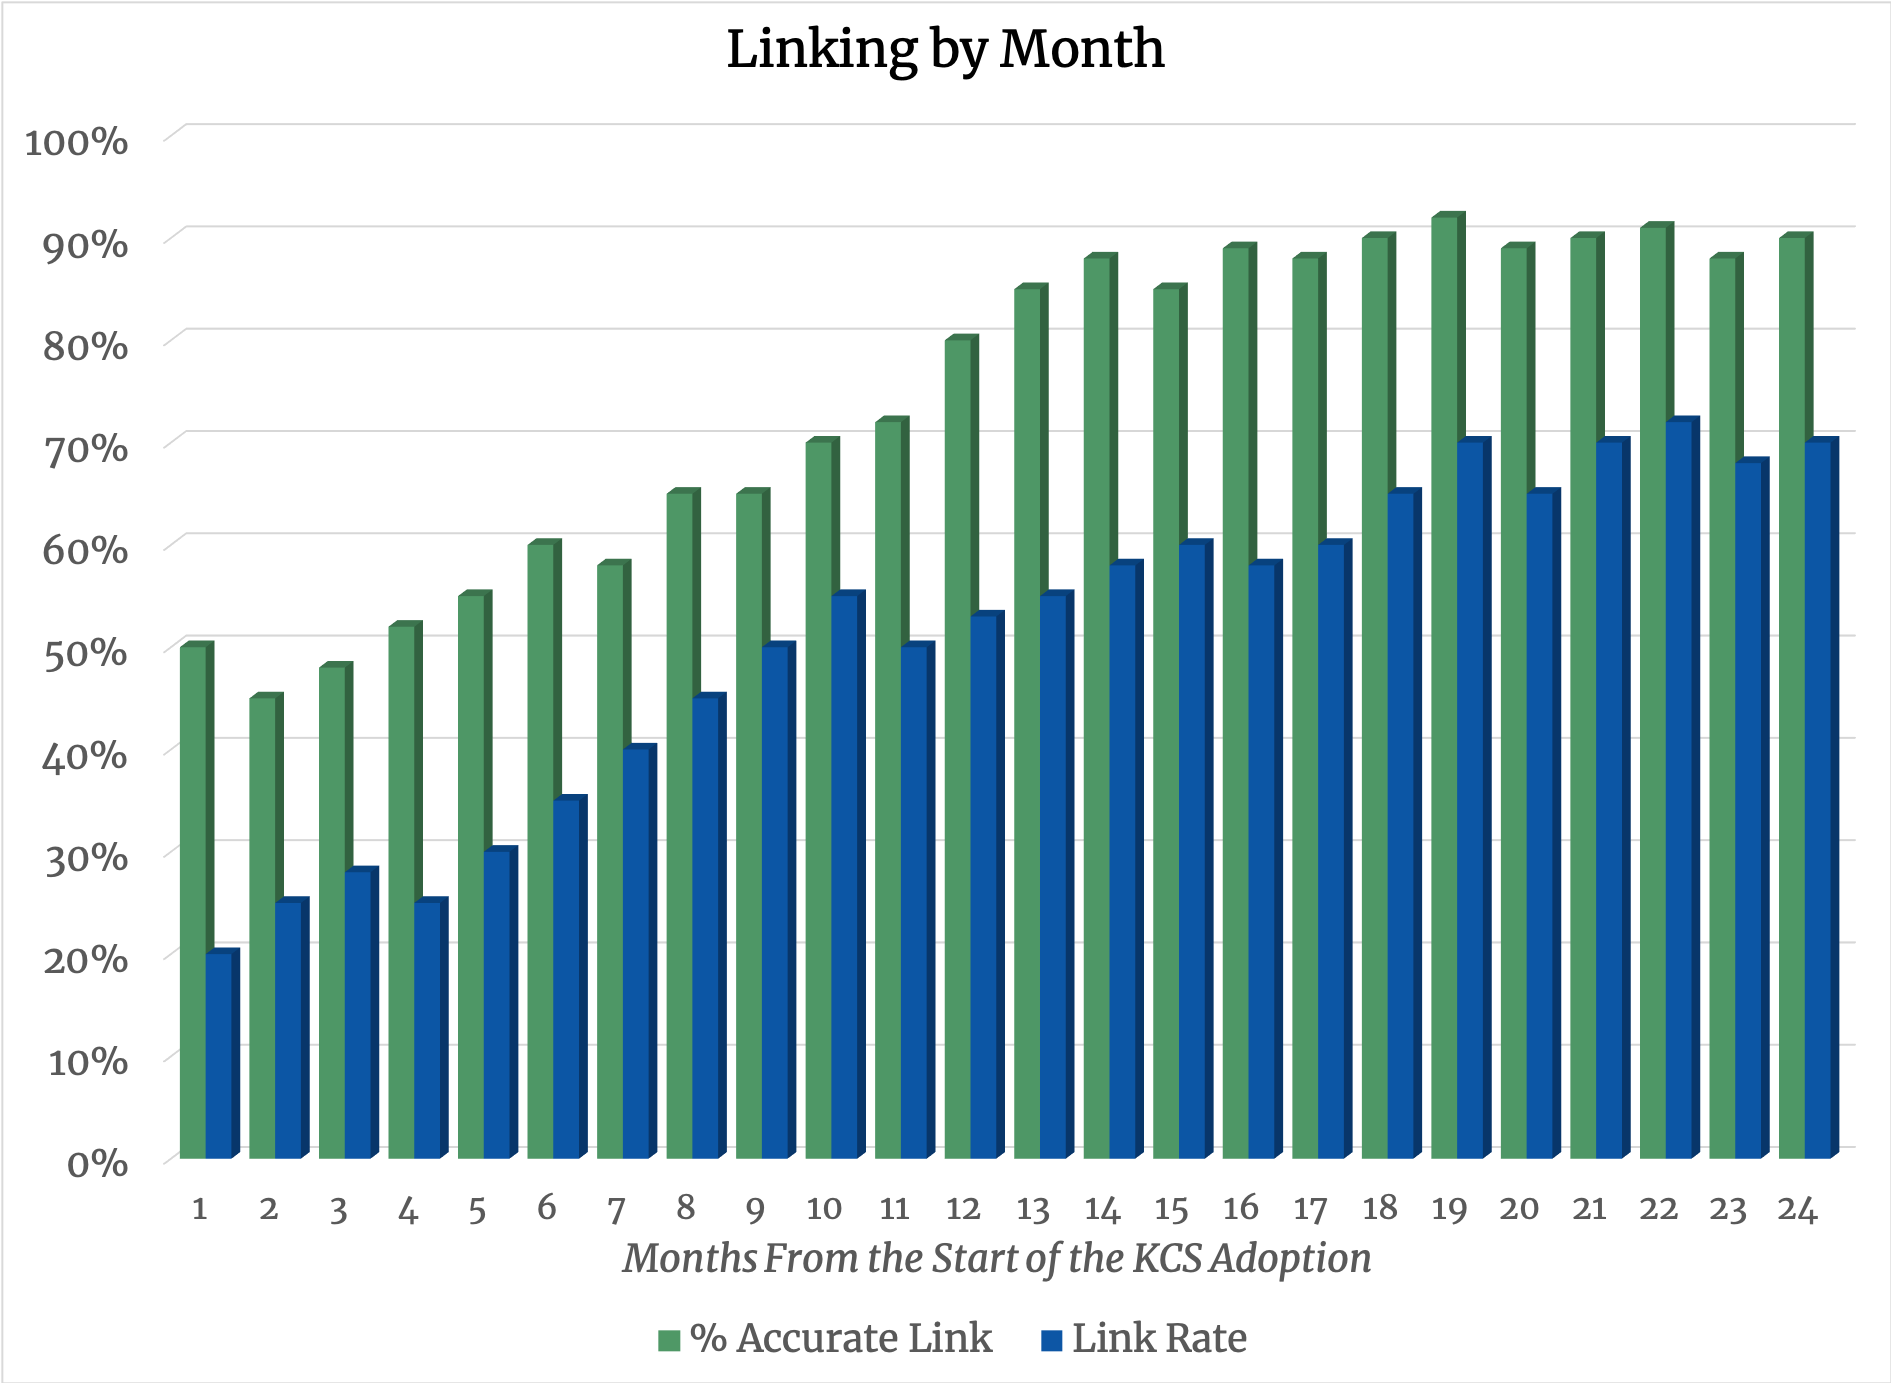
Expected trend over time:
New vs Known Ratio
The ratio of new issues versus known issues that come into the assisted model (the support center) is a powerful indicator of the success and value of our self-service model.
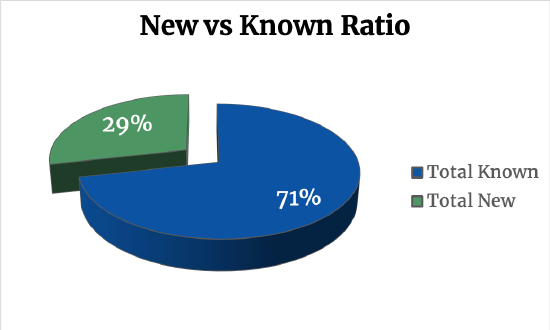 The baseline for the new vs known ratio is established in the initial New vs Known Analysis conducted for the domain.
One of the key goals for the KDA program is to shift the new vs known ratio towards a higher percentage of new requests coming into the support center. So, we might expect that over time the shift should look something like this.
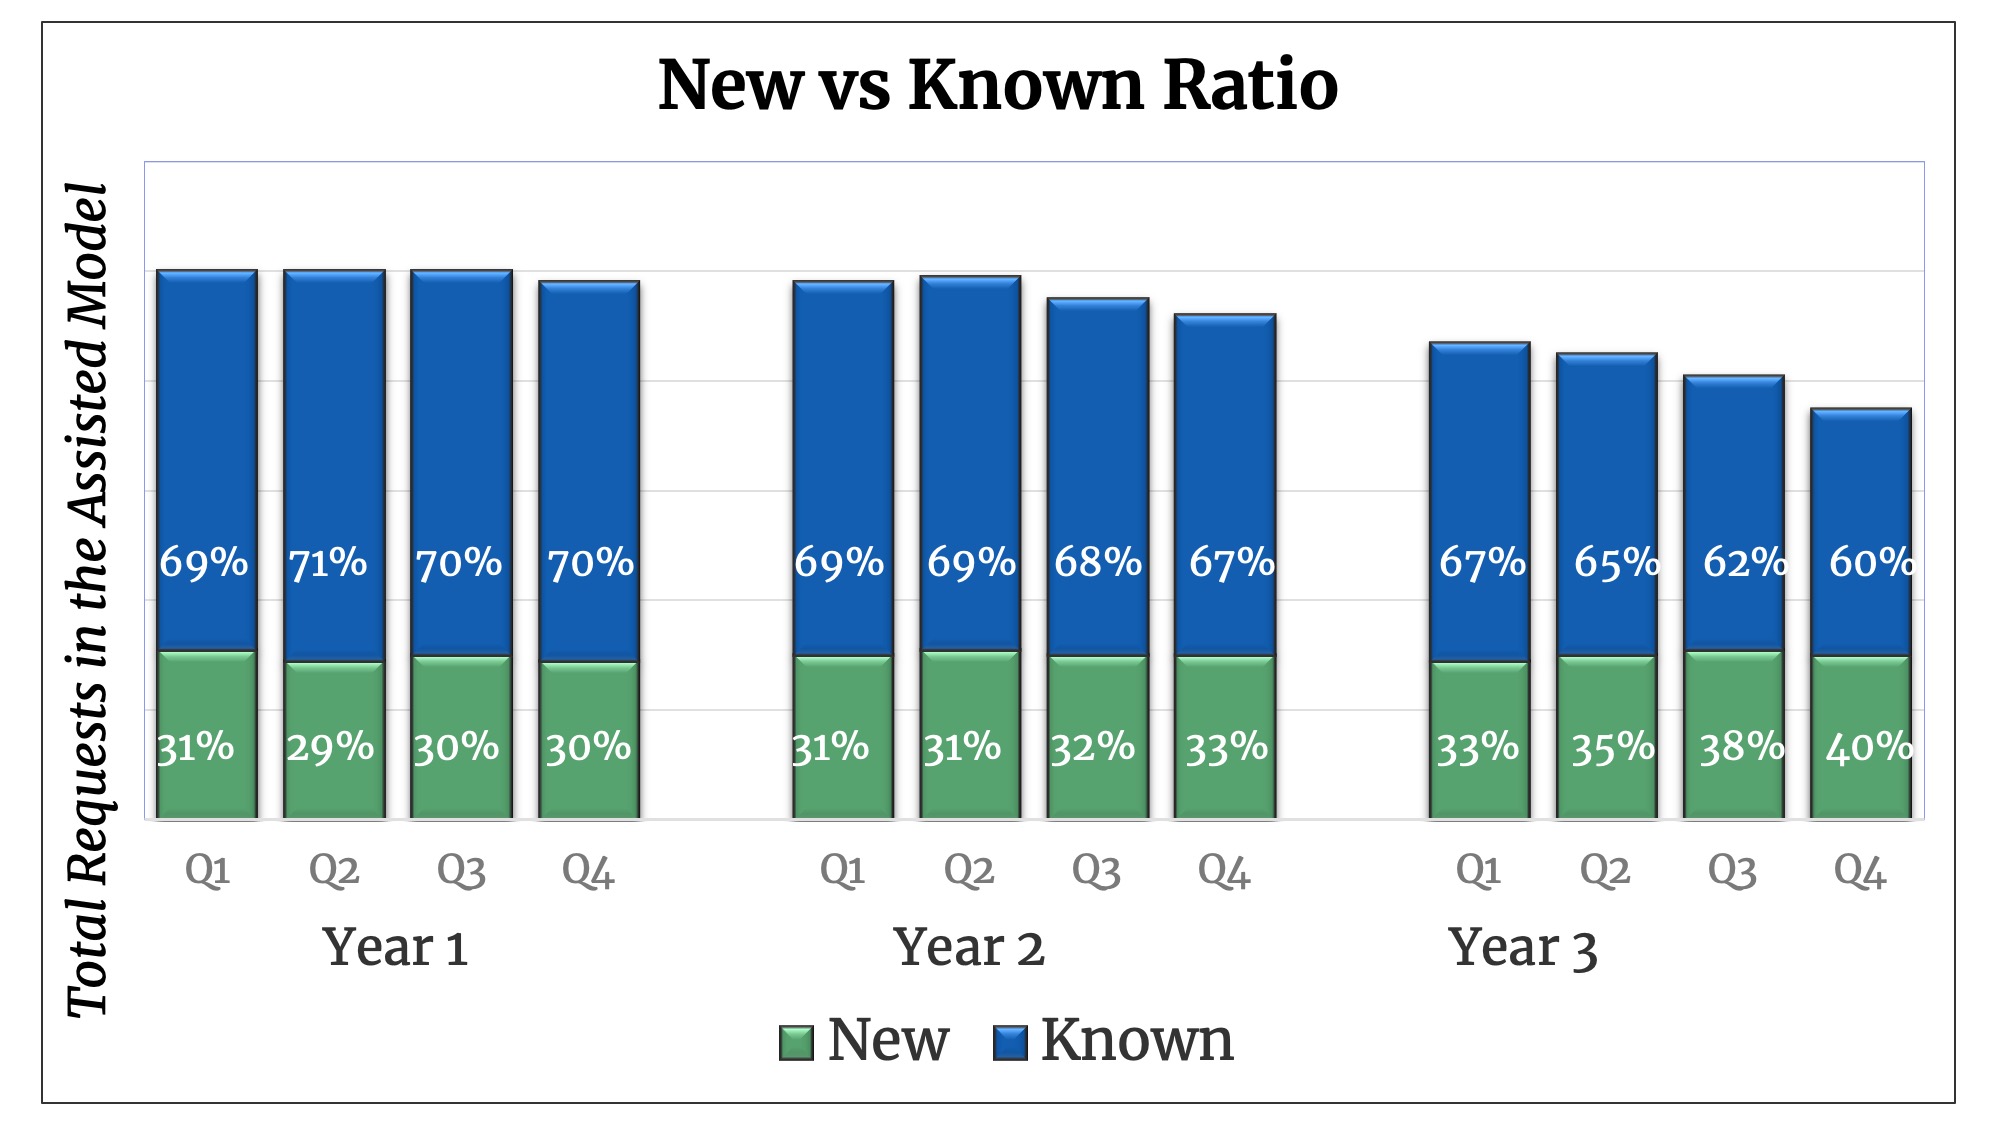
The scenario for this domain assumes a stable install base and no major changes to the offerings. And, the aggressive promotion of self-service happens at the beginning of year two. The first thing we notice with this forecast is it takes time to see a shift in the new vs known ratio. Second, we can see the total volume of requests is declining. It is about a 20% reduction in inbound requests, which is very conservative. This reduction is due to the gradual increase in self-service use and success by the requestors. We also see that the decrease in total request volume is because of the decrease in known issues. Our new issues remain fairly constant over time. Therefore the ratio of new to known issues being submitted to the assisted model is shifting to be a higher percentage of new; the ratio moves from a 30/70 new to known to a 40/60 new to known.
The perception is often that the work in the assisted model is getting more complex. That is not the case, it is the ratio of new to known that is changing. This trend over time is a strong indicator of success! And, it is the result of knowledge workers' use and contribution to the knowledge base over time that enables this success. Because this takes time to achieve and the shift happens slowly over time it is important that the KDEs communicate this success to both the knowledge workers as well as leadership.