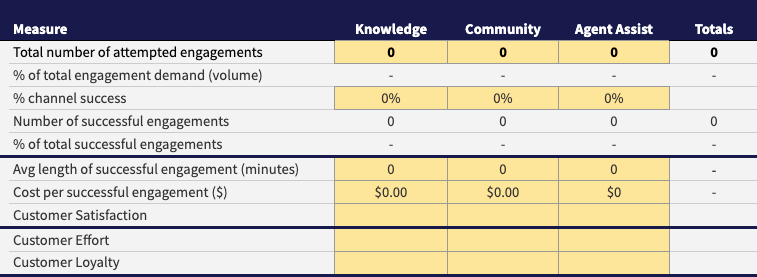
Service Engagement Measures Spreadsheet
There are three areas in which our measures are focused: Traffic & Success, Length & Cost, and Customer Experience. You don't have to tackle these all at once!
For each measurement, the goal is to use the most sophisticated approach you can from the good, better, and best guidance below - but don't let that stop you from using what you have available now to get started. Remember to get clear on your definitions first.
Guidance on the approaches are mostly offered for self-service and community engagements. Use your existing measures for agent assisted engagements.
Enter data in the yellow cells and the spreadsheet will calculate for you. Copy or download the Google Sheets template.
Community Engagements - February 2024 Addition
The Communities channel comprises two distinct primary activities—View Existing Threads (Known Issues) or Post a New Thread (New Issues). Calculating measures for both of these activities is key to have an accurate picture of your Community channel.
Consortium Members: sign in to see videos of context and approaches to measure Community engagement.
*Traffic & Success*
Number of Engagements
Volume of issues for which requestors pursue a resolution that we have visibility to. Often measured through attempts, sessions, sign-ons, searches and content views.
- Good = number of sessions or views per month
- Better = number of sessions per month that include at least one content view
- Best = same as better and includes criteria for a meaningful content view (i.e. time on page)
% of total engagement demand (volume)
Calculated percent of all the demand through all channels that we can assess.
% channel success
Approximation of issues resolved in channel. Often measured by surveys (low response rate and response bias), an estimated percent of sessions/visits without opening a case in some period of time (24 hours - 7 days), or number of views divided by an average number of views/issue. The intent is to measure how often a requestor issue is resolved per self-service (the requestor is done with indication of success) and assisted (closed case with resolution offered).
- Good = percent of sessions/visit without request for assistance OR number of views divided by an assumed avg number of views/issue. Note: this does not account for the significant % of issues that are abandoned (without resolution or an assist request). Some apply a % abandon rate.
- Better = survey "were you successful?" percent "yes", apply confidence interval to ensure you have a large enough sample size. Correlate your results with "good".
- Best = sophisticated clickstream analysis (percent of patterns that represent success or failure). This is an area of exploration and we are looking for examples of what this might look like!
Number of successful engagements
Calculated volume of completed engagements based on number of total engagements multiplied by % channel success.
% of total successful engagements
Calculated ratio of successful engagements in channel as a percent of total demand.
This calculation is a reflection of Customer Experience and indicates opportunities to improve content and mechanisms.
*Length & Cost*
Average Length of Successful Engagement
Customer time to resolve, requires assumptions based on your products and customers. Authentication can help with measuring length of engagement.
- Average time of a sample of successful sessions (using clickstream analysis). Note: as you improve the accuracy of identifying successful sessions, this will improve the accuracy of your measures.
Cost Per Successful Engagement
Total costs (may include salary, systems, overhead) associated with self-service (not easy) allocated based on time spent on tasks and the volume being served (cost/min and cost/engagement).
This is a great spot to use your organization's existing calculation for costs. The Consortium's position is that all KCS-related costs should be counted under Assisted Engagements since even without fueling self-service, KCS provides ongoing benefit to the organization.
*Customer Experience*
Customer Satisfaction
Existing standards: survey. How satisfied were you with your experience?
Customer Effort
Survey results depends largely on customer expectations.
- Good = Survey
- Better = Sophisticated click stream analysis
- Best = Journey mapping and tracking improvements in the journey over time
Customer Loyalty
Use Net Promoter Score (NPS) or other existing standards.

